Efficient public transportation is essential for sustainable cities, yet many transit networks struggle to meet the needs of diverse populations. This website showcases the results of the research into public transport infrastructure from the Data Analysis and Visualization Group (DBVIS) at the University of Konstanz, Germany together with the Steinbeis Competence Centre for Interactive Data Analysis and Visualization at the University of Konstanz. The site offers online tools, research results, and datasets that present complex underlying public transport raw data in an accessible way and actionable for fellow researchers, policymakers and the general public.
Our Vision: By leveraging visual analytics and data-driven insights, we aim to provide a transparent, detailed assessment of public transport systems. Our research focuses on two key aspects:Both analyses are based on an innovative approach that integrates multiple data sources, simulation models, and enriched GPU-powered map visualizations to evaluate and improve public transport systems at a housing-level granularity - for the first time ever. We also share our data results with the community to facilitate open research and further applications.
Why It Matters: Traditional transit planning often relies on limited data and generalized assumptions. Our approach offers a new perspective by simulating daily travel patterns of varied demographic groups and analyzing their unique mobility needs. This enables the identification of strategic improvements, such as optimized bus schedules or relocated stops, ensuring better service for all, relying on an objective and scalable data-driven methodology.
We invite you to explore our analysis through our online viewers, use our dataset for further analysis, and join the conversation about creating more inclusive, efficient, and transparent public transport systems. Do not hesitate to get in contact if you are a fellow researcher, city staff member, or policymaker: max.fischer@uni-konstanz.de, we are open for your insights and look forward to discussing your ideas.
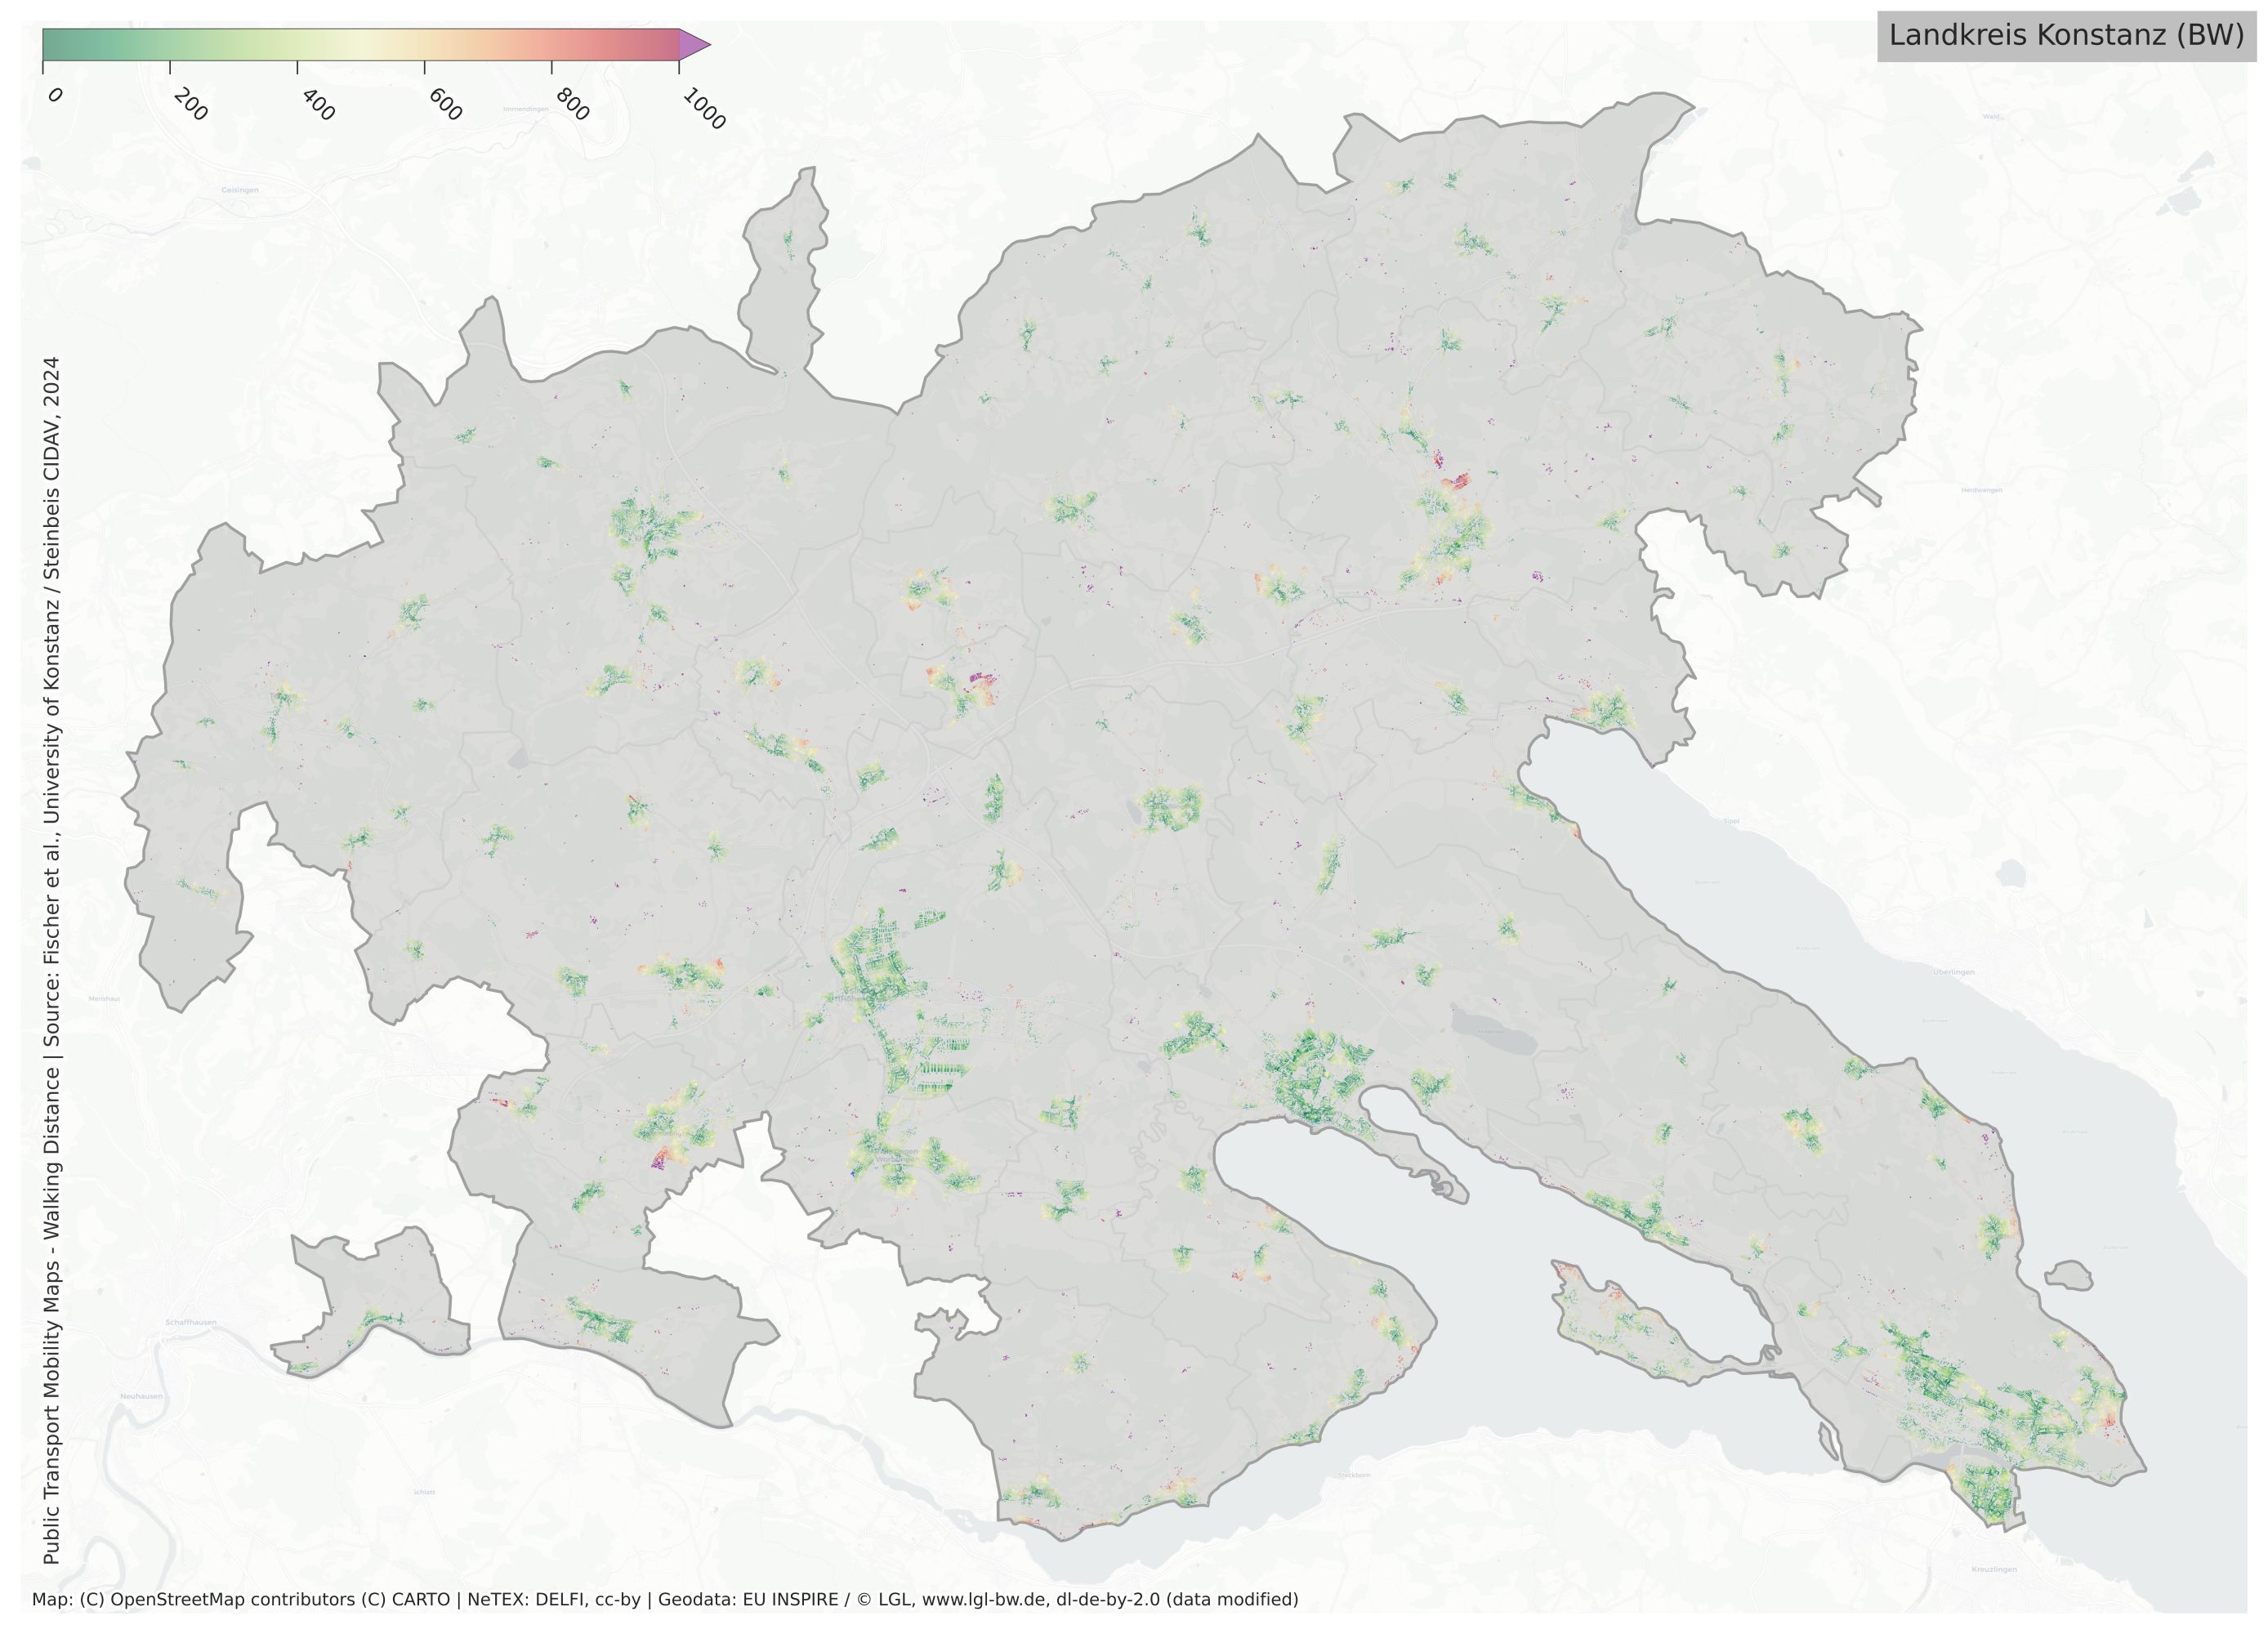
Interactively explore the accessibility of public transport stops in your neighborhood. you can select between two modes. In the following, you can explore:
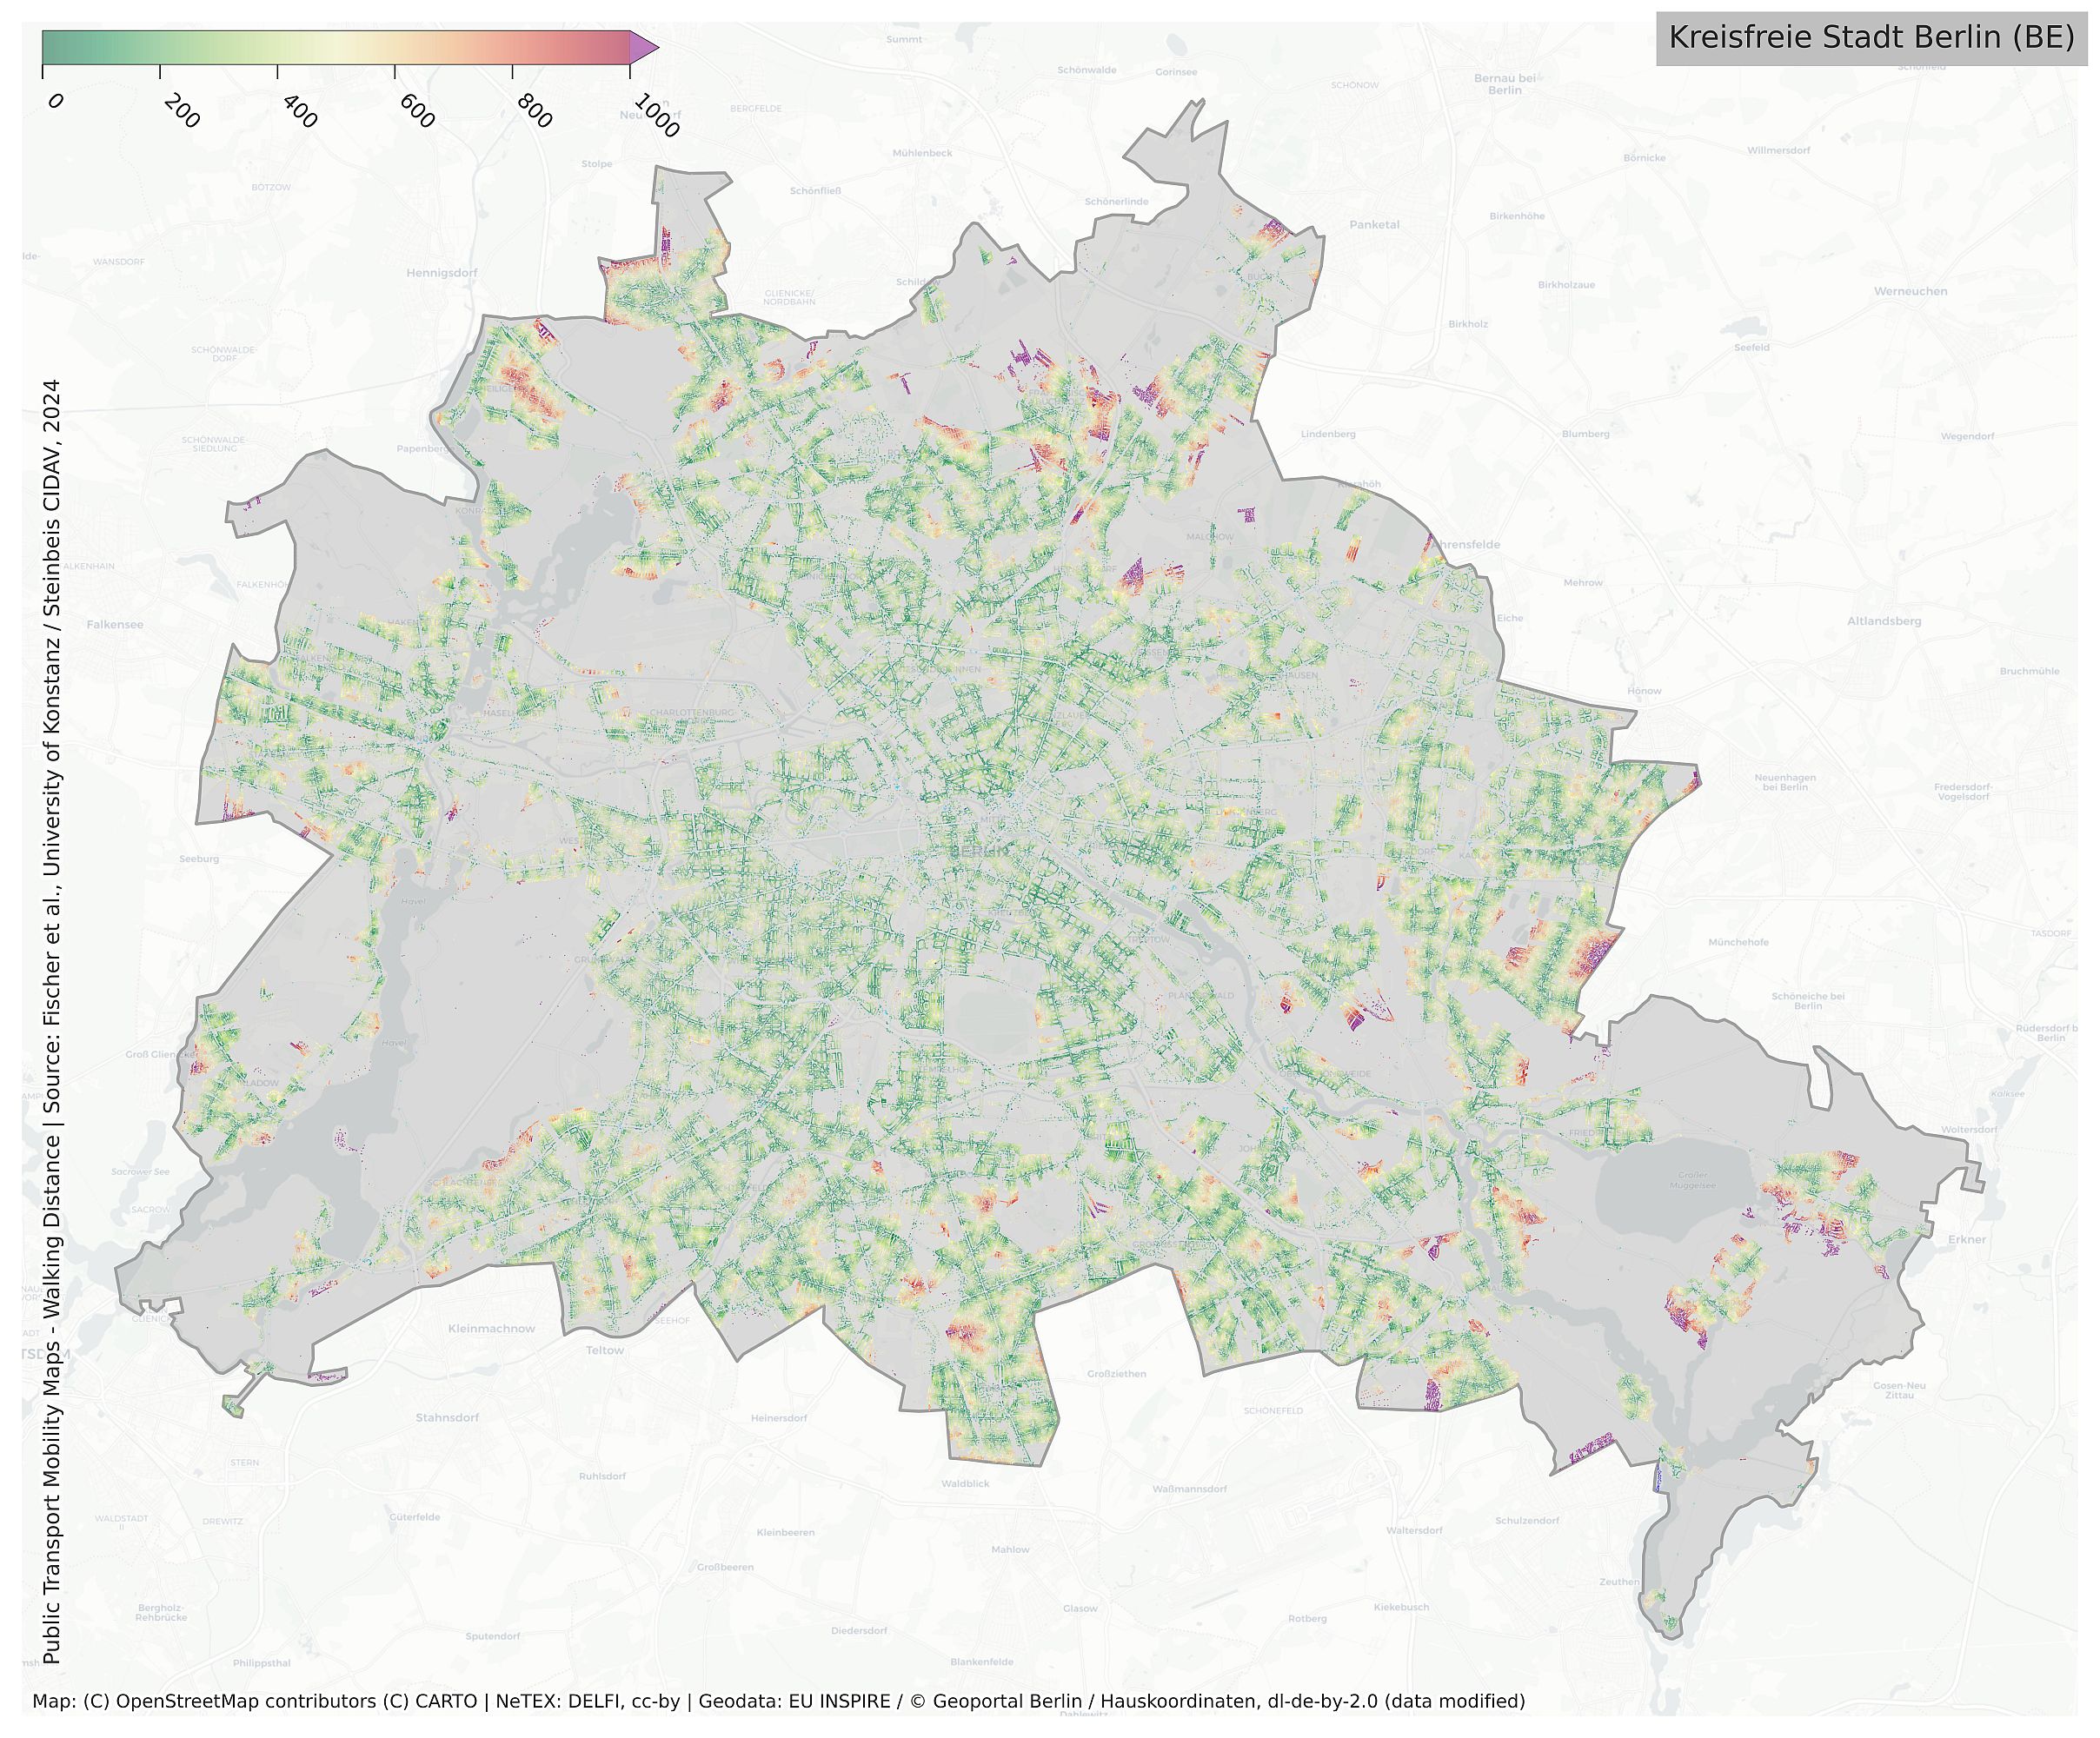
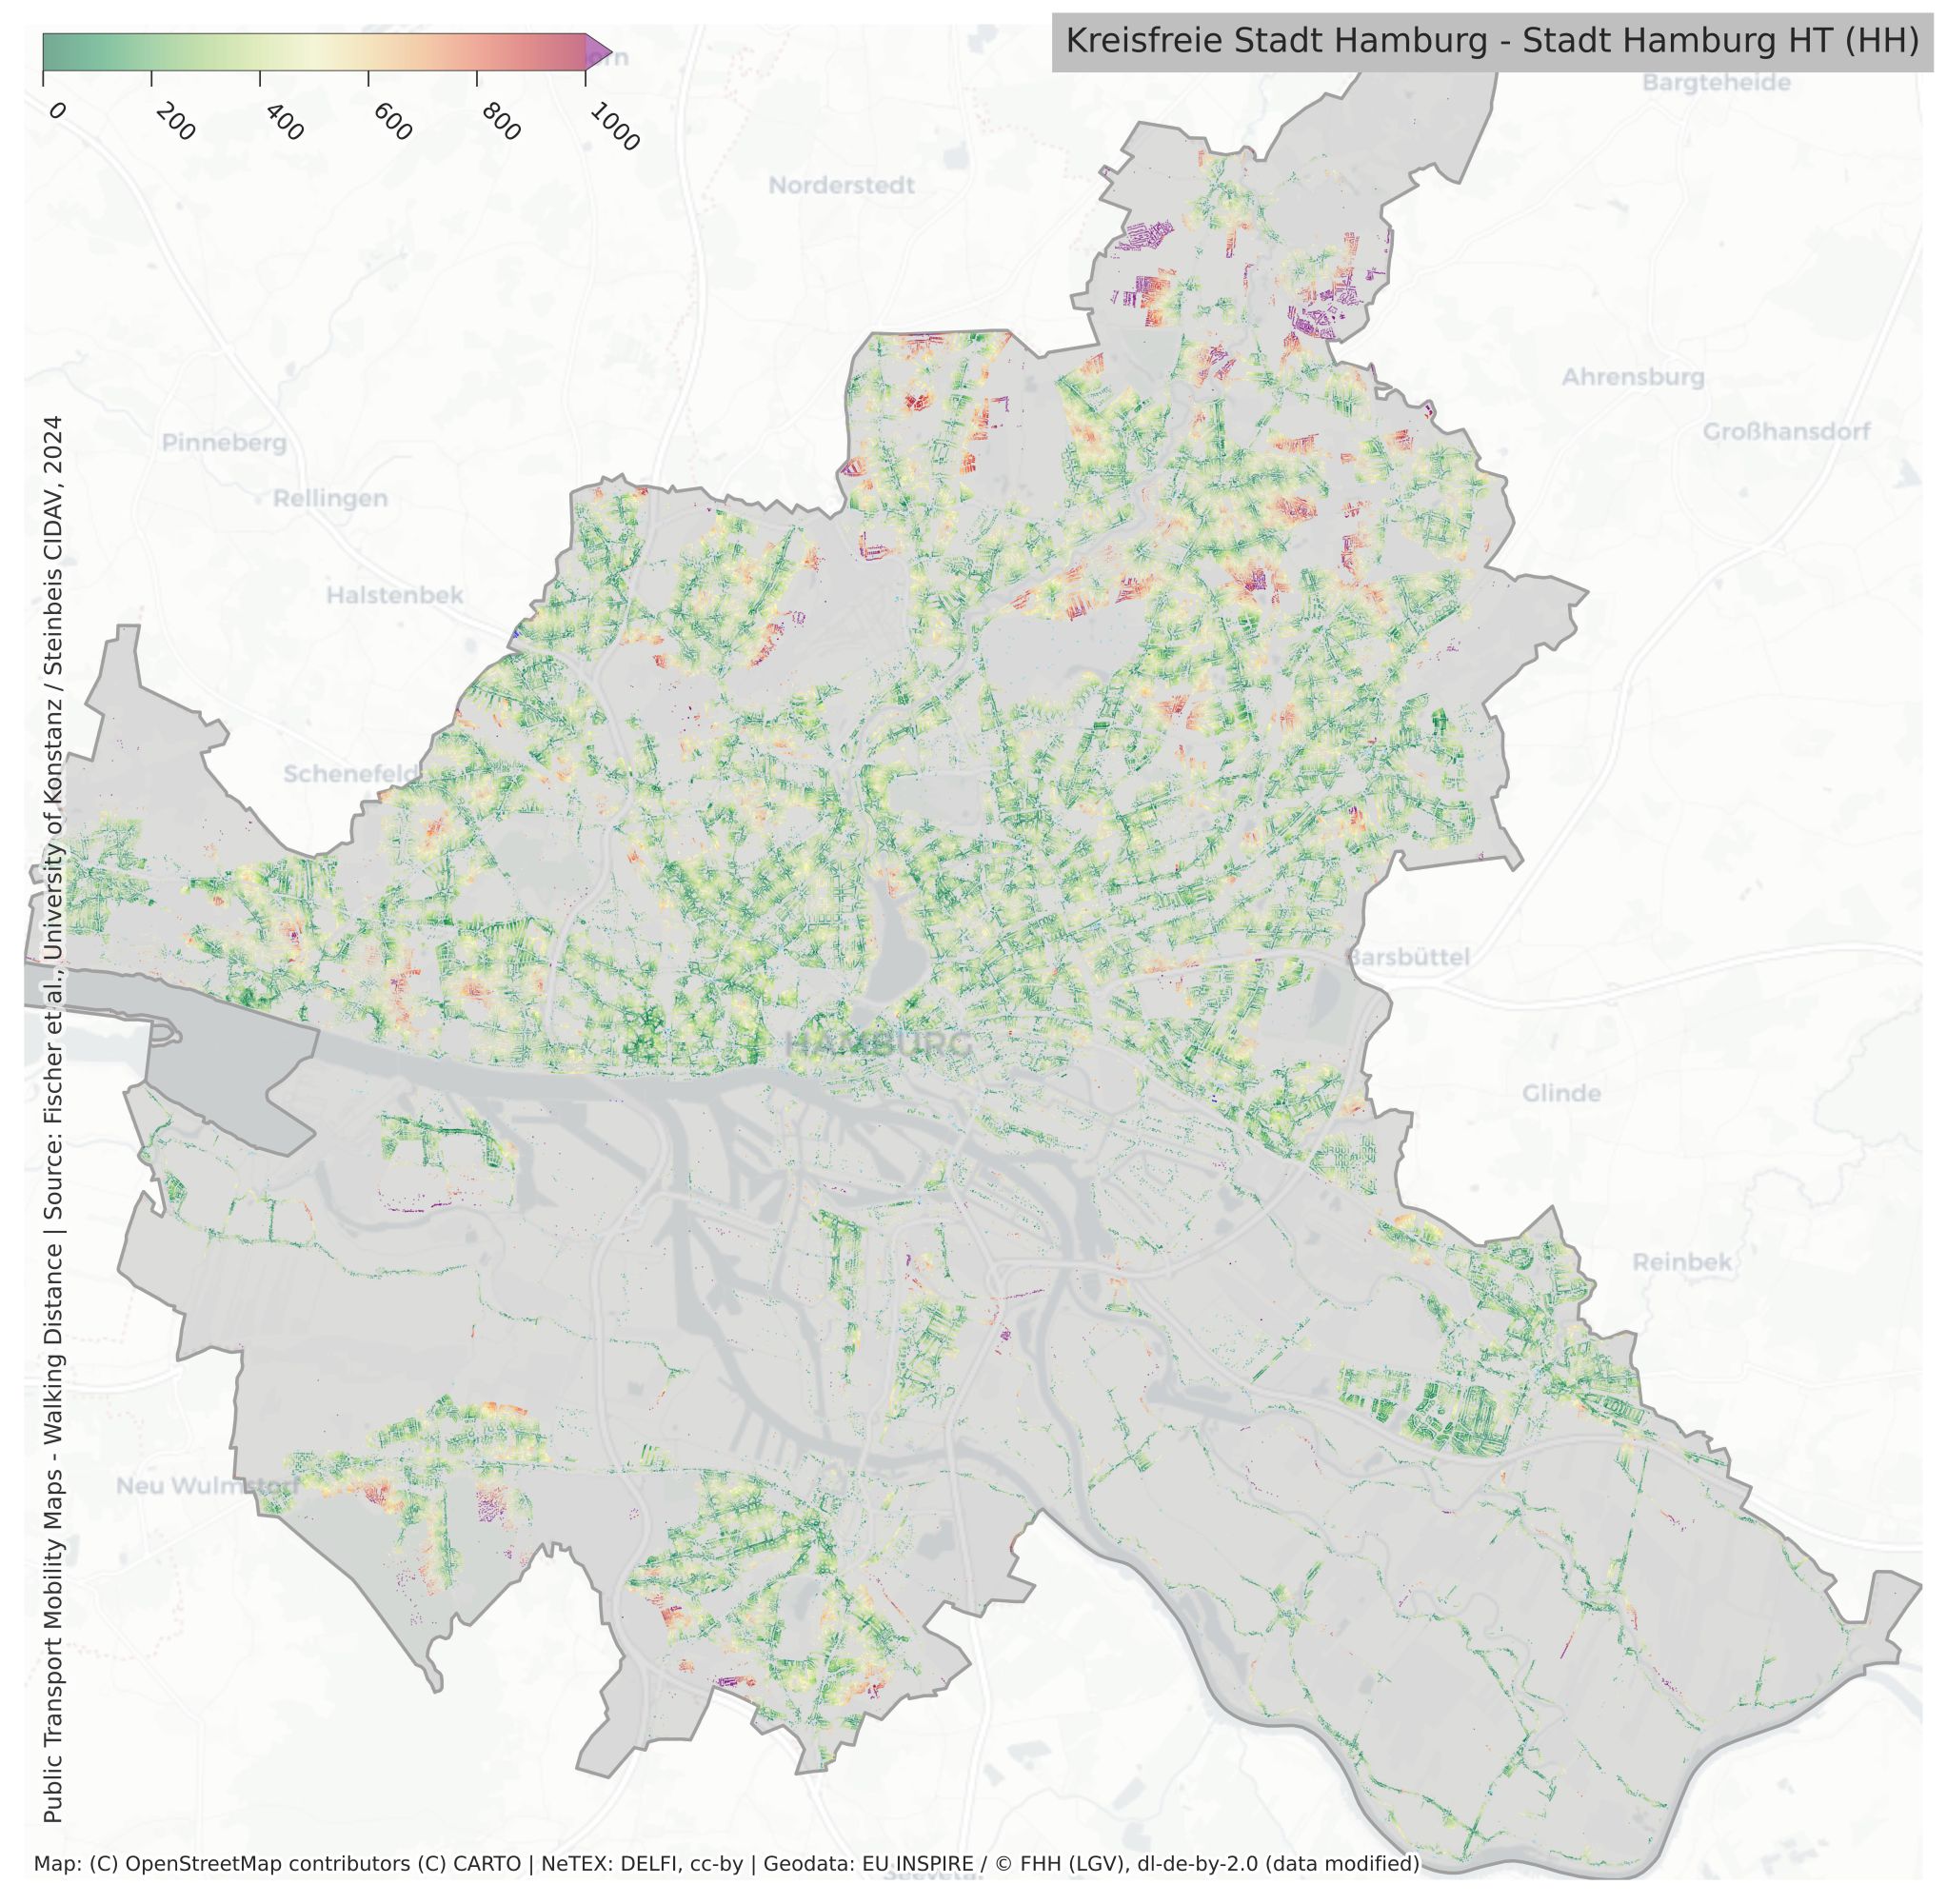
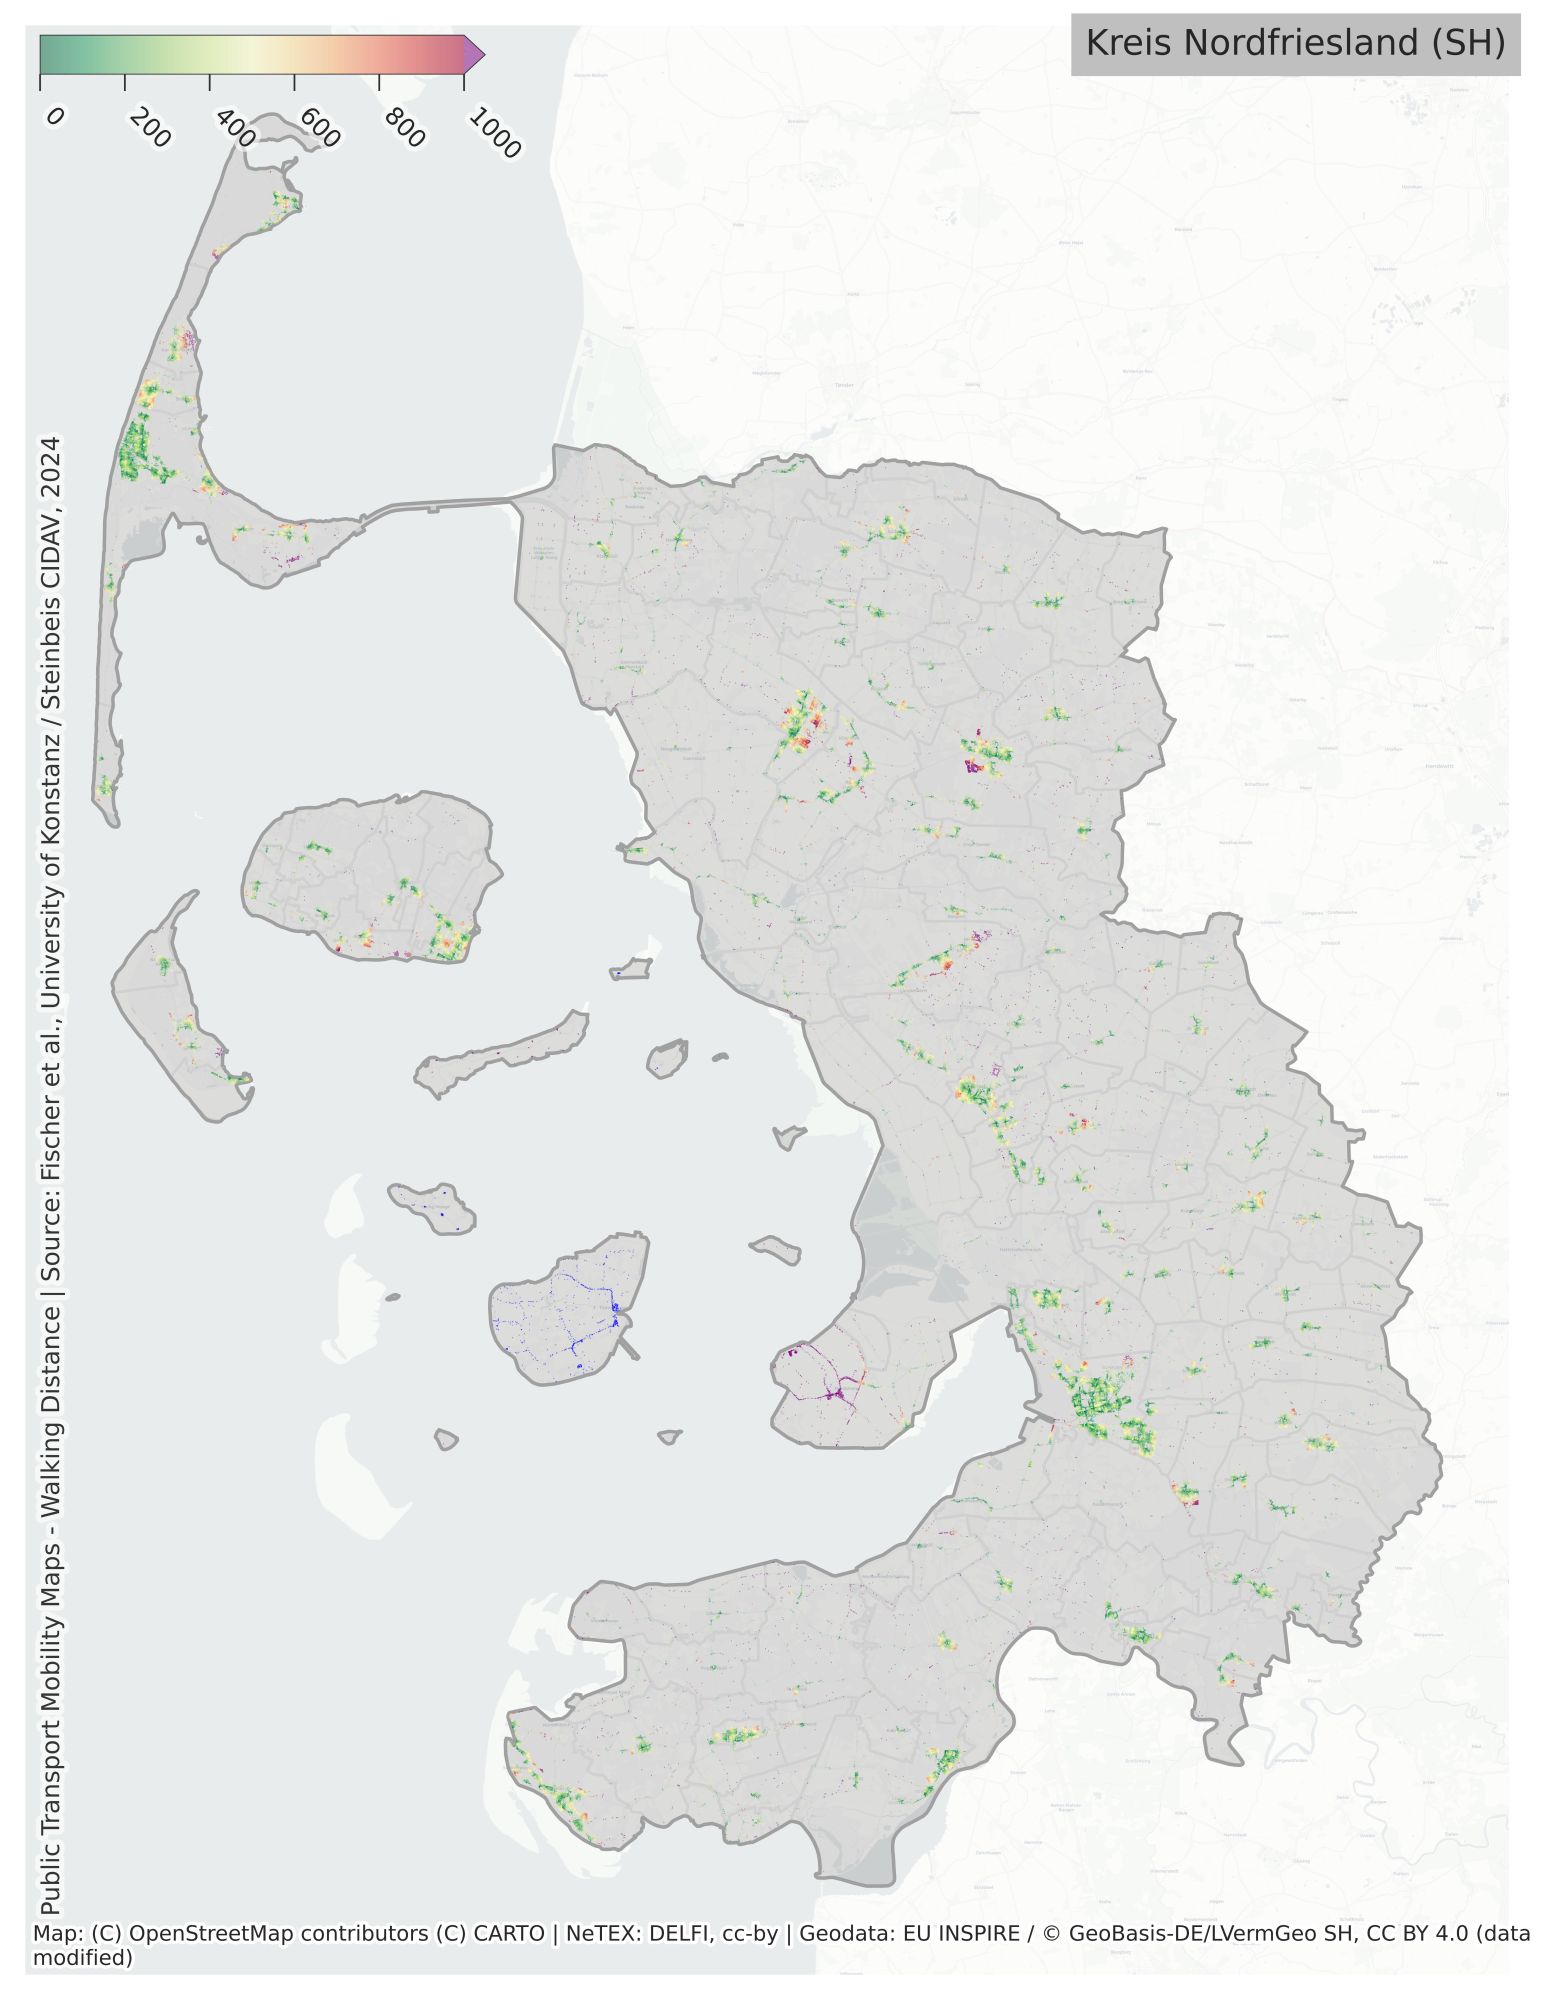
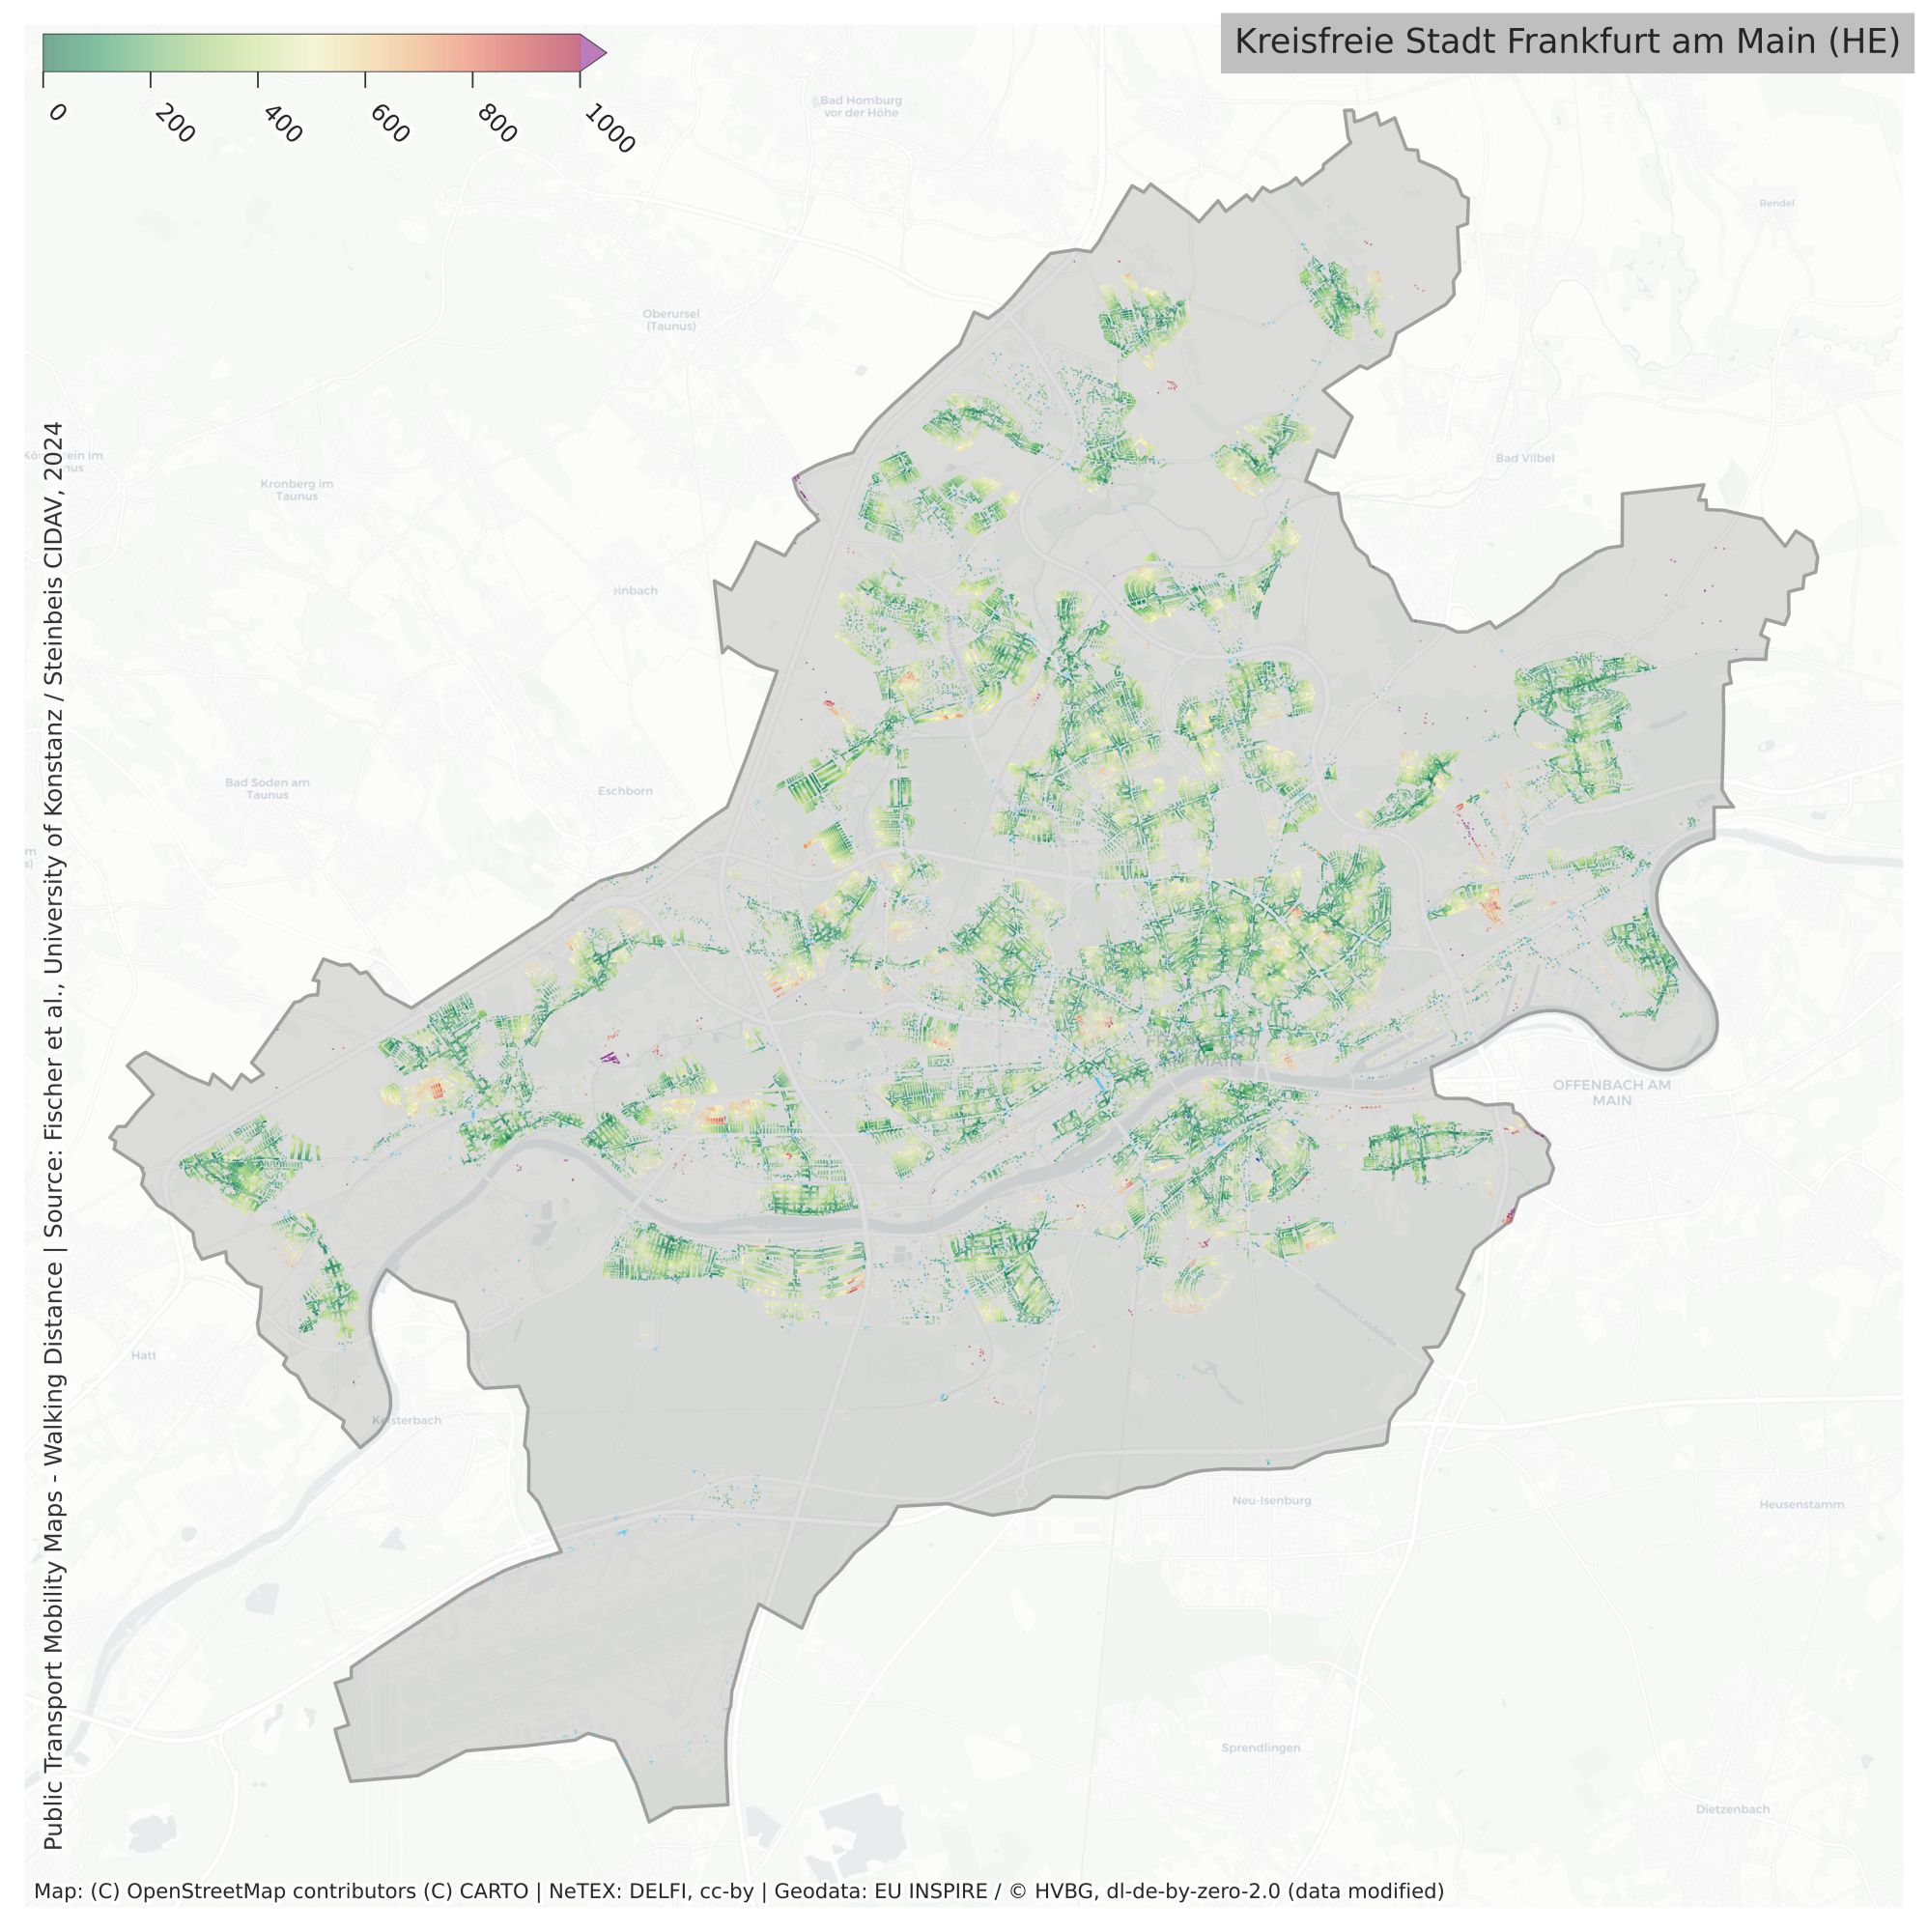
In the case the above interactive viewer does not load for you or you just want a pre-computed map for you country, check out the following:

We provide a subset of the results from our analysis in a machine-readable format for further analysis as the MOBILITY MAPS dataset.
This dataset (current version: July 2025, the older version from late 2024 is no longer available) contains both the approximate walking distances in meters and a weighted overall quality score in an artificial time unit for each individual house in Germany. For caveats and more information, consult the FAQ below. More advanced versions are currently not publicly available. You can download the accompanying dataset on Zenodo.When using the data in you analysis, please cite as:
M. T. Fischer, D. Fürst, Y. Metz, M. Schmidt, J. Rauscher, D. A. Keim "MOBILITY MAPS: A dataset for Open Public Transport Infrastructure and Mobility Accessibility Profiles", Zenodo, 2025, doi: 10.5281/zenodo.14772646.
The results presented above are based on research conducted at the Steinbeis Competence Centre for Interactive Data Analysis and Visualization at the University of Konstanz in collaboration with the Data Analysis and Visualization Group (DBVIS) at the University of Konstanz, Germany. Find more about our research at DBVIS here.
The underlying research has been published in a journal paper referenced below:
1Corresponding author: max.fischer@uni-konstanz.de
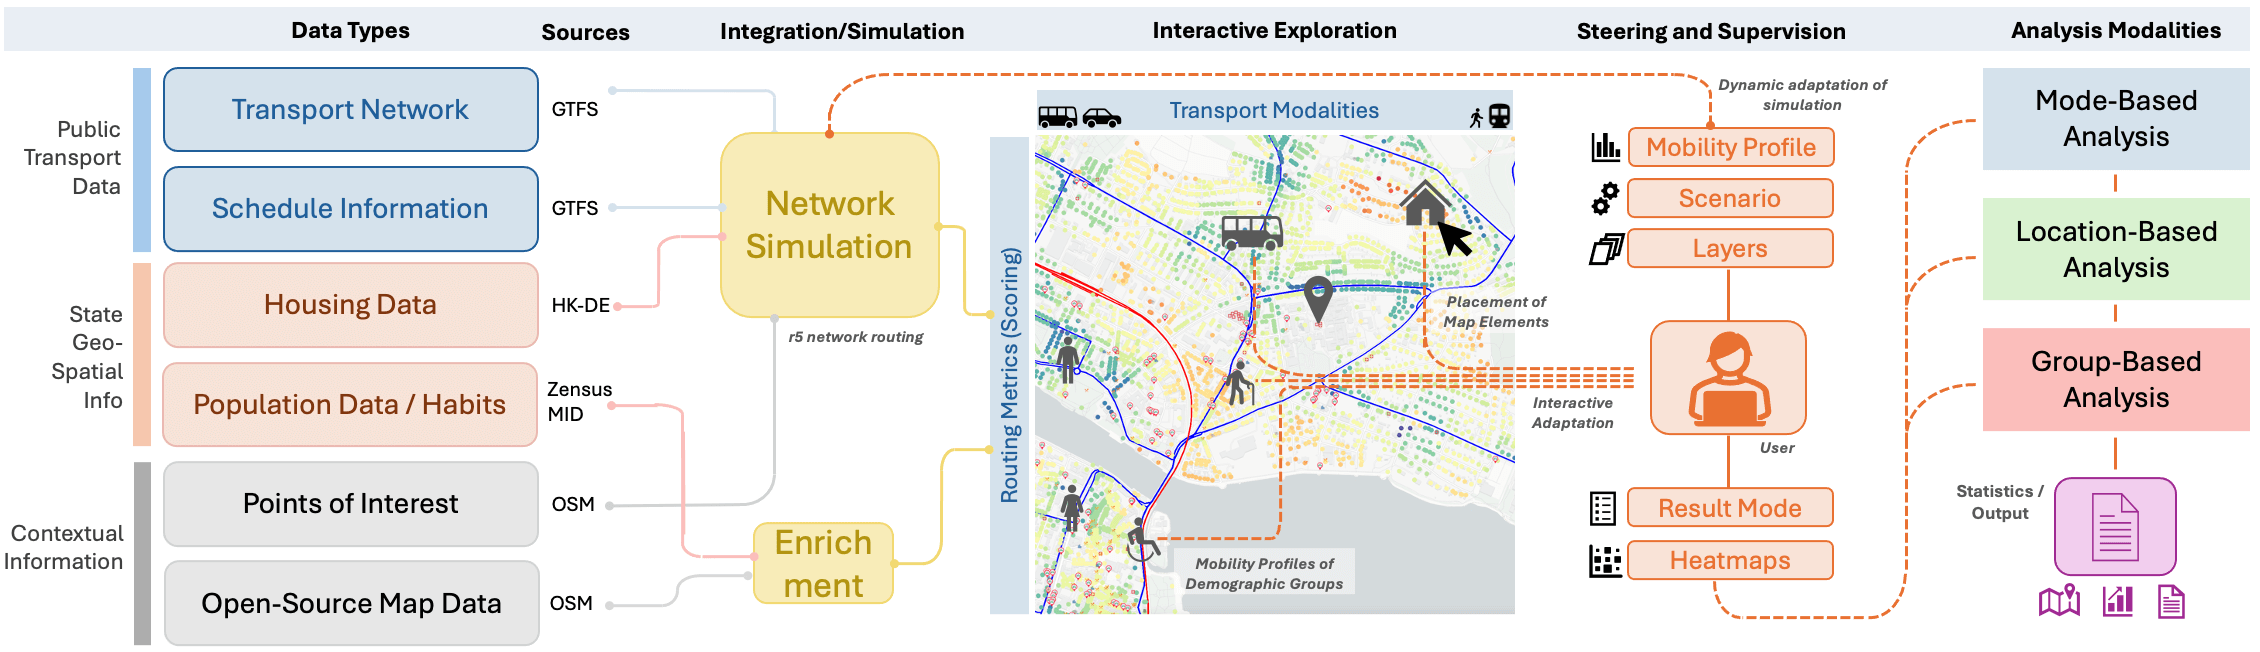
Our workflow for the creation of mobility profiles for the analysis and improvement of public transport infrastructure: The approach combines multiple open data sources and integrates them together with aggregated network flow simulations from existing frameworks through an enriched map visualization to assess the quality, i.e. connectedness and travel times, of public transport at housing-level detail. Exploration and steering, changing how persons move between their homes and various POIs as part of their daily routine, is enabled by interactively adapting simulation constraints and aggregations. Further, it allows us to analyze the effect of network changes on the population’s connectivity. Our demonstrator enables multiple analysis modalities: As output, heatmap visualizations, usage statistics, and quantitative reports can be extracted, detailing which transportation modes work, how accessible locations are concerning travel- and wait times, and how good the network reflects the need of different population groups.
Efficient public transport systems are crucial for sustainable urban development as cities face increasing mobility demands. Yet, many public transport networks struggle to meet diverse user needs due to historical development, urban constraints, and financial limitations. Traditionally, planning of transport network structure is often based on limited surveys, expert opinions, or partial usage statistics. This provides an incomplete basis for decision-making. We introduce a data-driven approach to public transport planning and optimization, calculating detailed accessibility measures at the individual housing level. Our visual analytics workflow combines population-group-based simulations with dynamic infrastructure analysis, utilizing a scenario-based model to simulate daily travel patterns of varied demographic groups, including schoolchildren, students, workers, and pensioners. These population groups, each with unique mobility requirements and routines, interact with the transport system under different scenarios traveling to and from Points of Interest (POI), assessed through travel time calculations. Results are visualized through heatmaps, density maps, and network overlays, as well as detailed statistics. Our system allows us to analyze both the underlying data and simulation results on multiple levels of granularity, delivering both broad insights and granular details. Case studies with the city of Konstanz, Germany reveal key areas where public transport does not meet specific needs, confirmed through an initial user study. Due to the high cost of changing legacy networks, our analysis facilitates the identification of strategic enhancements, such as optimized schedules or rerouting, and few targeted stop relocations, highlighting consequential variations in accessibility to pinpointing critical service gaps. Our research advances urban transport analytics by providing policymakers and citizens with a system that delivers both broad insights with granular detail into public transport services for a data-driven quality assessment at housing-level detail.
The research presented here is based on the following publication. Cite this as:
Y. Metz, D. Ackermann, D. A. Keim and M. T. Fischer, "Interactive Public Transport Infrastructure Analysis through Mobility Profiles: Making the Mobility Transition Transparent," 2024 IEEE Visualization in Data Science (VDS), St. Pete Beach, FL, USA, 2024, pp. 6-14, doi: 10.1109/VDS63897.2024.00006.
@INPROCEEDINGS{MetzAckermannKeimFischer.PublicTransportAnalysis.VDS.2024,
	author={Metz, Yannick and Ackermann, Dennis and Keim, Daniel A. and Fischer, Maximilian T.},
	booktitle={2024 IEEE Visualization in Data Science (VDS)},
	title={Interactive Public Transport Infrastructure Analysis through Mobility Profiles:
           Making the Mobility Transition Transparent
	},
	year={2024},
	volume={},
	number={},
	pages={6-14},
	keywords={Surveys;Analytical models;Schedules;Visual analytics;
	    Simulation;Urban planning;Public infrastructure;Data visualization;
	    Quality assessment;Public transportation;Public transportation network;
	    mobility transformation;agent-based simulation;visual analytics;housing-level
	},
	doi={10.1109/VDS63897.2024.00006}
}